

Technical Information
Key Topics:
-
-
Sample Preparation
-
Breakage test using the Geopyörä device
-
Product size analysis
-
Density measurements (SG)
-
Device Specifications
The Geopyörä breakage device has the following properties:
-
Dimensions: 1500 x 1000 x 1100 mm
-
Weight: 400 kg

Test Concept
The Geopyörä breakage test characterizes ore hardness from small, discrete samples. Each test produces the Geopyörä Index (GPi), our own index of ore hardness calculated directly from the energy and force measured during breakage. With our developed deep neural network models, the test also delivers the industry-standard comminution parameters: Axb and DWi for impact breakage, BWi for grindability, and rock mechanical properties such as UCS and PLT. From a single test, these results feed directly into geometallurgy, mine-to-mill and feasibility workflows to forecast throughput, de-risk projects and protect NPV.
The test uses two counter-rotating wheels to break rocks at a controlled reduction ratio. Particles are fed automatically, one after another, without stopping or resetting between breaks, which keeps it fast enough for high-volume testing of assay-scale samples. Force and energy are measured for each particle as it fractures: energy from the loss of rotational speed (momentum) of the wheels, and force from the load cells. Because the force needed to fracture a rock depends on its strength, varying the degree of reduction maps its full breakage response and gives a direct, accurate measurement of the energy absorbed.
.

Test Procedure
Sample Preparation
-
Crush the sample using a jaw crusher with a CSS of 20 mm
-
Sieve the material using the following (six) screen:
-
> 31.5 mm
-
> 26.5 mm
-
> 22.4 mm
-
> 19 mm
-
> 16 mm
-
> 13.2 mm
-
-
-
Choose the largest size fraction with more than 30 particles for testing (the sizes in bold are the recommended sizes for the test)
-
Avoid flaky particles
-
Breakage test using the Geopyörä device
-
Set the gap for the corresponding size fraction
-
Weight and feed the particles
-
For the Geopyörä V1 an external scale must be connected to the computer
-
For the Geopyörä V2 the feeder and scale are already integrated in the device
-
-
Performe the breakage of all sample particles
-
Collect the broken product for size analysis
Size analysis
-
Use a deck with the following nine sieves:
-
1 Pan
-
1 Bond sieve
-
3 sieves below t10 size
-
3 sieves above t10 size
-
1 safety sieve for unbroken particles
-
-
Sieve for 5 minutes using a RoTap or similar
-
Upload data into Geodata to obtain your results
-
Final results are obtained immediately upon data upload
Geopyörä test validation
The following section provides data comparing the accuracy of the Geopyora tests with the primary tests in the comminution market. All the data presented has been collected from various papers and publications.
Geopyörä DWI comparison
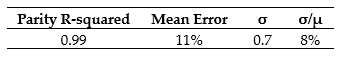
TThe Drop Weight Index (DWi) is an important measure of rock strength and competency, originally derived from the SMC Test®. Geopyörä predicts the DWi using a deep neural network model trained on our extensive global database, which spans reference data from deposits worldwide.
The graph displays the parity plot of our model to the reference data. Notably, 80% of the samples fall within a 15% disparity range, with a final R squared of 0.99. These results highlight the exceptional accuracy and performance of our machine learning models.

Geopyörä Axb comparison
Geopyörä uses its breakage data to calculate the Specific Comminution Energy (Ecs) for each particle. The resulting breakage product is then sieved to determine the percentage passing one-tenth of the initial mean particle size (t10). Using the DWi calculated through our deep neural network model, Geopyörä generates the A×b parameter based on the following equation developed by Alex Doll:

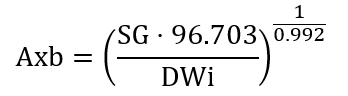
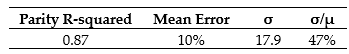
The provided image presents the parity plot in which compares the estimated Axb values obtained by Geopyörä with the reference values from the SMC Test® Axb. 79% of all reference samples are within the established 15% disparity range and with an overall R squared of 0.87.
Geopyörä BBMWi comparison
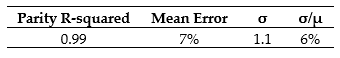
Geopyörä also utilizes a machine learning model to calculate the BBMWi (Bond Ball Mill Work Index) parameter from the data generated by our test.
The corresponding graph shows a parity plot, where 92% of the samples fall within the ±15% dispersion range, represented by the blue data points. In addition, the table provides a summary of the comparison statistics, indicating an exceptionally robust correlation, with a high parity R-Squared value of 0.99.

Simulate quotation with our PRICE CALCULATOR
For a more in-depth understanding of the Geopyörä test, visit our Publications section
